Property investment should never be about ploughing your hard-earned money into the next ‘hot-spot’. Looking at unbiased information – facts and figures – is a better way to work out where to invest next.
In August 2018, PIPA (Property Investment Professionals Australia) released a helpful snapshot of which Australian states have performed well over the past 30 years.
The findings:
No market performed consistently well over this period. The best way to gain is to find out which markets have bottomed out and are set to improve.
But how will you know when this has happened?
Without the expertise and information, it’s tough for most investors to figure this out.
PIPA chairman Peter Koulizos explains:
“Investors should seek independent qualified property investment advice to give themselves the best chance of getting the best returns on their money, as timing the property market can be just as important as time in the market.”
This doesn’t mean you need to take anyone’s word for it, no matter who they are. Look at the facts and figures on easy-to-understand charts. They don’t lie. Come to your own conclusions.
Let’s go through a few charts together so you see how we work out which areas to invest, shall we?
Which Australian markets have bottomed out?
With Australian property markets moving in different cycles and at different speeds it would make good financial sense to buy at the bottom of a market and enjoy the equity uplift as the market increases in value.
Let’s take a look at the chart below which shows median house prices of the 4 biggest capital cities of Australia since 1990. (source ABS)

Chart: Median House Prices – Australia 1990 – 2018
If you could go back in time and had the ability to invest in Sydney, at which letter would have you invested? a, b, c or d?
Hopefully you chose C because you would have most likely doubled the value of your investment in 5 short years.
Those who invested at A had to wait 9 years to get to the start of the next upward movement.
What do you think will happen to the Sydney market over the next few years?
If history is anything to go by it will probably have a period of correction.
So where should we invest?
We know that population growth is a major factor for increasing demand and reducing supply for properties, which usually increases their value.
Therefore we need to know the areas that have strong forecast growth. To help us work that out, see the chart below which shows Population Projections by City.
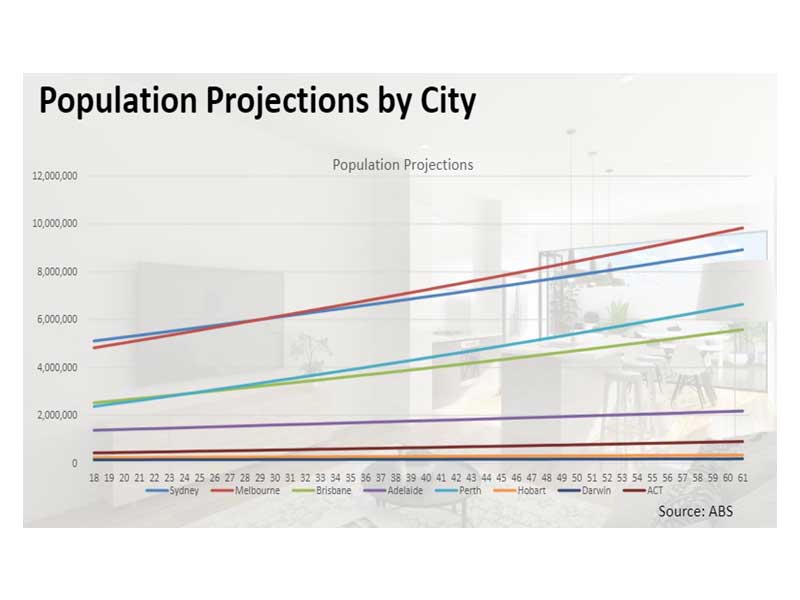
Chart: Population Projections by City
The same big 4 cities are clearly leading the way: Melbourne, Sydney, Perth, and Brisbane.
Meanwhile, Adelaide, ACT, and Hobart markets have stayed constant, with neither growth nor fall in their populations.
How does this compare to what the boffins saying?
The next chart shows the forecasted total growth of each major city until 2021. BIS Oxford Economics has forecast Brisbane to experience the most growth over the next few years based on infrastructure and affordability.
Infrastructure improves employment opportunities and lifestyle – the 2 key factors people look for when choosing where to live.

Chart: Total Growth 2018 to 2012 (%)
In the Housing Affordability chart we see how affordable housing is in the major capital cities.
It is great to be labelled the world’s most liveable city (or one of) – but if people can’t afford to live there, what do they do?
They move.

Chart: Housing Affordability: – Housing price to median income ratio (x)
This is what has led to Queensland now being the number 1 state for interstate migration. The chart below shows Queensland’s Population Growth Breakdown from 1997 to 2017. From 2015 to 2017, Queensland’s population grew by more than 20,000 people from interstate.
 With the mainstream media labelling the ‘Australian property market’ as one market and sensationalising its performance or lack thereof, I just wanted to share some food for thought.
In summary
There’s an ongoing avalanche of tips about the next hotspots. Unfortunately, much of that advice is given with ulterior motives. Unlike opinion, facts and figures can give you a more informed view to help you make better decisions about one of the biggest purchases you’ll ever make.
Today you’ve found out there’s more than one market: every Australian capital city is its own market and trends in different ways. Aspects to consider when finding the next place to invest include:
- Median house price forecasts
- Population growth
- Housing affordability
- Growth (infrastructure and affordability)
What market do you think is due to perform next?